
The Ocean Is Now an Energy-Market Indicator
The surface of the world's oceans has never been this warm for this time of year. On 21 June 2026, the global average sea-surface temperature (SST) reached roughly 20.86°C, narrowly beating the previous records set in 2023 and 2024. By the end of June, the global SST anomaly hit its highest-ever value for the date, and around 82% of the ocean was under marine-heatwave conditions of some intensity. For anyone buying power in Europe this summer, that is no longer just an environmental headline. It is a leading indicator for demand, generation and price volatility.
What happened
Two things are happening at once. The first is the long-term ocean warming trend that Copernicus attributes to climate change. The second is the onset of El Niño, which the World Meteorological Organization (WMO) confirmed in early June. The WMO now expects El Niño to strengthen rapidly through July–September and reach "strong" status, the third of four intensity categories, with central and eastern equatorial Pacific temperatures forecast to run more than 2°C above normal. Model agreement is unusually high, which raises confidence in the outlook even if the exact regional effects remain uncertain.
Warm oceans and a strengthening El Niño load the dice towards heatwaves, drought and heavy rainfall. Europe felt the first taste in late June: AleaSoft reported that the heatwave lifted electricity demand and pushed weekly average day-ahead prices above €115/MWh in most major European markets, with weaker wind output in Germany and Italy adding to the pressure.
Why energy markets care
Heat moves the whole power stack at once, and rarely in the buyer's favour.
On the demand side, cooling load rises as air-conditioning and refrigeration ramp up. That lifts consumption into the afternoon and early evening, often just as solar output begins to fade, tightening the balance during the most expensive hours.
On the supply side, heat is a double squeeze. Prolonged dry spells reduce hydro reservoir levels and river flows, cutting hydropower availability in southern Europe. High river temperatures and low flows can also force nuclear and thermal plants to throttle back, because they cannot discharge cooling water without breaching environmental limits — France has curtailed nuclear output in past heatwaves for exactly this reason. Solar panels themselves lose a little efficiency at very high cell temperatures, and calm, high-pressure "heat dome" conditions frequently coincide with low wind, as Germany and Italy saw in June.
The result is a market where demand climbs while several supply sources weaken together. That is the classic recipe for price spikes and higher intraday volatility, even without any change in gas or carbon prices.
Why it matters for energy buyers
For procurement and portfolio teams, the practical message is that weather risk this summer is skewed to the upside on price. A single prolonged heatwave can turn a benign forward curve into a run of stressed spot sessions. Buyers relying heavily on spot exposure, or on merchant renewable output to cover load, are the most exposed to that skew.
It also complicates the demand side of the equation. Sites with significant cooling load may see consumption profiles shift, which matters for anyone managing peak charges, demand-response commitments or imbalance exposure.
What buyers should watch this summer
A few indicators are worth tracking directly rather than waiting for the monthly reports. Watch temperature and wind forecasts for the coming one to two weeks, since heat-plus-low-wind is the combination that hurts most. Keep an eye on hydro reservoir levels and river temperatures in France, Iberia and the Alpine region, which drive both hydro and thermal availability. Follow the WMO's monthly El Niño updates for any upgrade in intensity or shift in timing. And watch the spread between baseload and peak prices — a widening spread is often the first sign that the system is struggling to cover late-afternoon load.
Closing thought
The ocean has become a genuinely useful input to an energy buyer's dashboard. It will not tell you tomorrow's price, but a record-warm sea surface and a strengthening El Niño tell you something about the distribution of outcomes you are hedging against — and that distribution now leans towards more heat, more volatility and more frequent stress in the hours that cost the most.
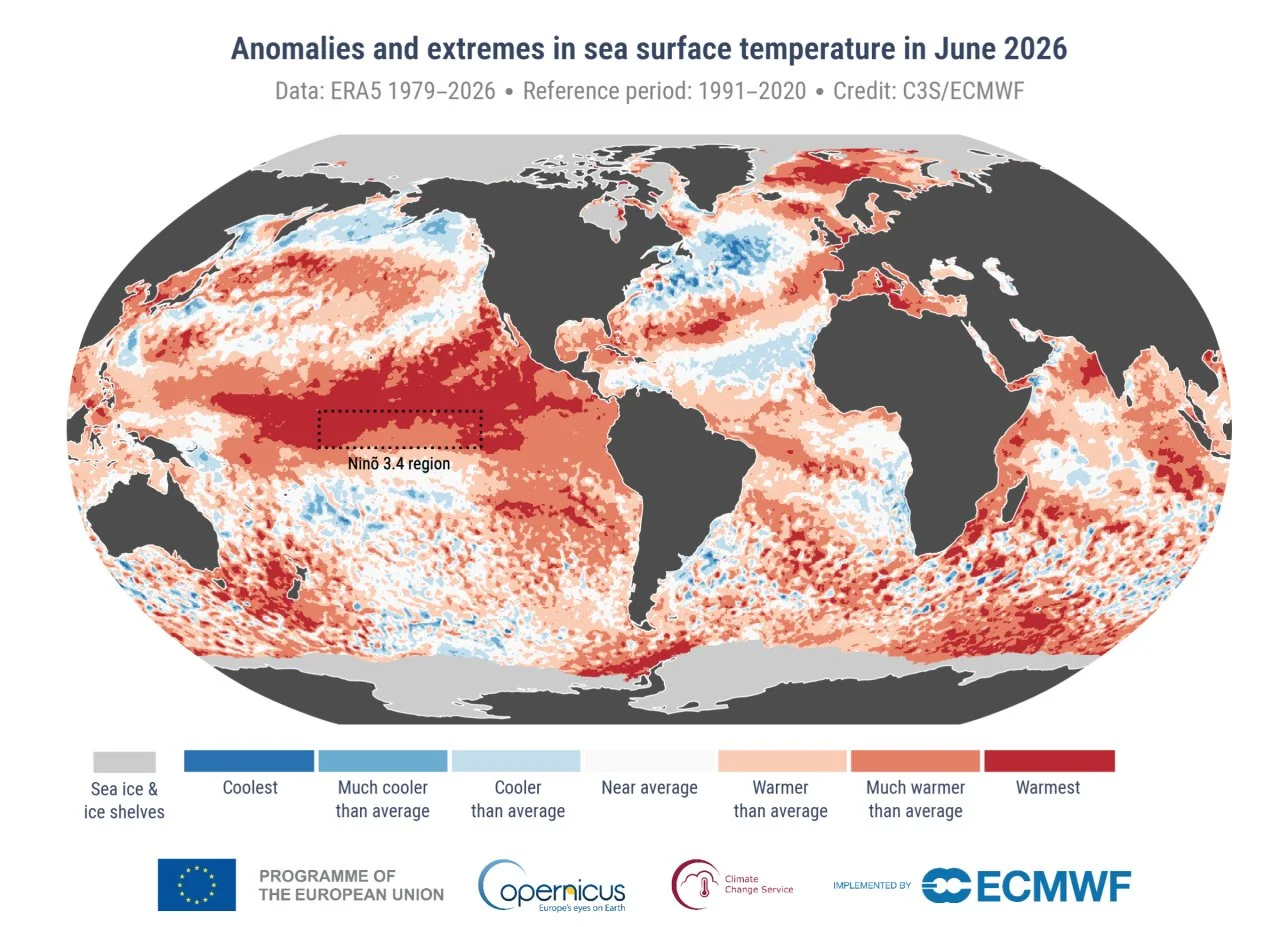
Anomalies and extremes in sea surface temperature for June 2026. Colour categories refer to the percentiles of the temperature distributions for the 1991–2020 reference period. The extreme (“coolest” and “warmest”) categories are based on June rankings for the period 1979–2026. Values are calculated only for the ice-free oceans. Areas covered with sea ice and ice shelves in June 2026 are shown in light grey. The map outlines the Niño 3.4 region used to monitor El Niño conditions. Data source: ERA5. Credit: C3S/ECMWF.